
🔍 Instruction Finder – Plugin for Cheat Engine 🔍
Instruction Finder is a lightweight Lua plugin for Cheat Engine that helps you search the Memory Viewer – Disassembler for matching instructions, then trace selected rows to collect the memory addresses they access.
The plugin is designed for reverse engineering and trainer research workflows where you need to find candidate instructions, check what addresses they touch, compare hit counts, and save the collected results for later analysis.
Instead of manually scrolling through the disassembler and testing one instruction at a time, you can scan a custom address range, use wildcard or sequence patterns, trace one or more selected memory instructions, use quick selected-row patch actions, and review the accessed addresses in a second table with live values.
Update v1.1 (25/June/2026)
🔢 Added selected instruction row counting in the preview label.
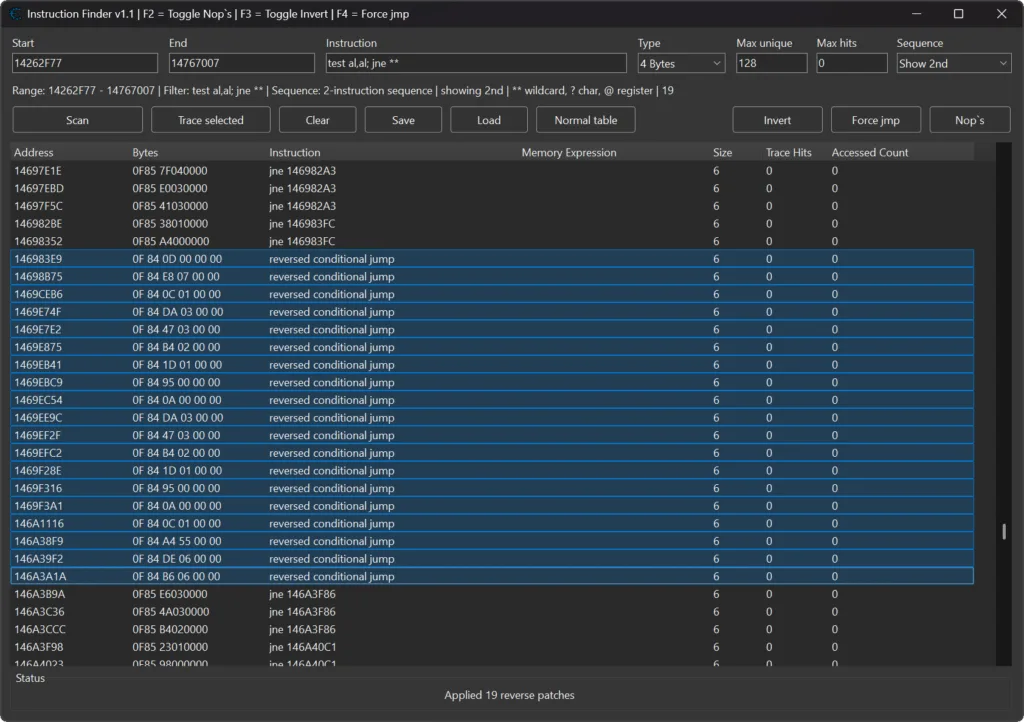
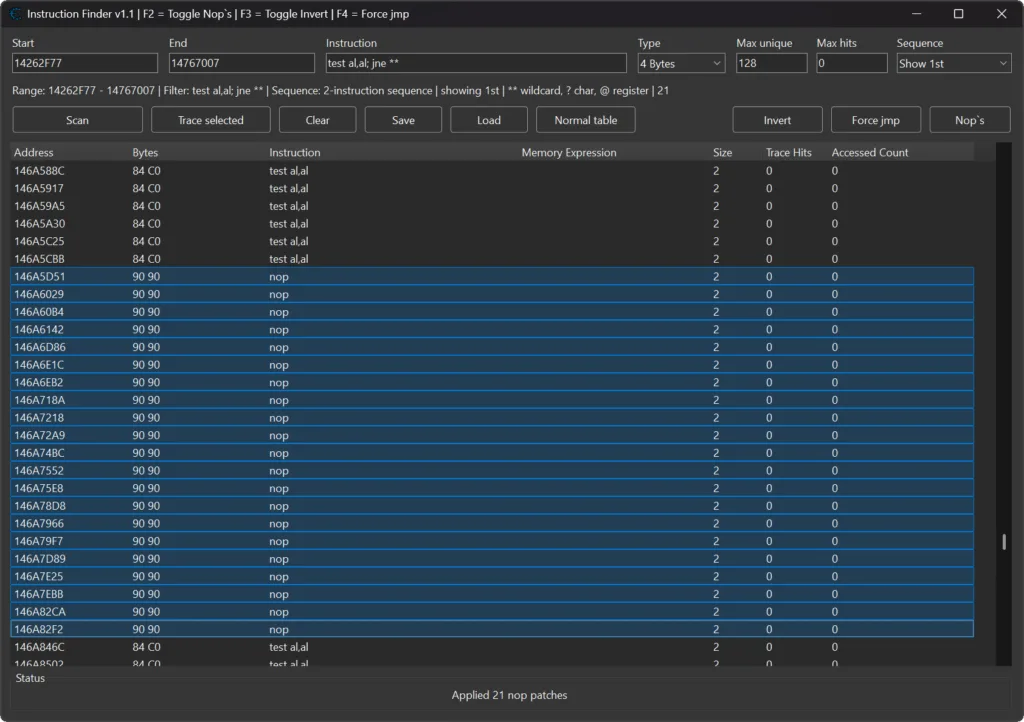
🛠️ Added selected-row Invert, Force JMP, and NOP patch buttons with restore tracking.
⌨️ Added F2, F3, and F4 hotkeys for selected-row patch actions.
🔍 Added semicolon-based sequence searches, for example test cl,cl; je **.
🔀 Added a sequence display combo box for choosing the first or second instruction in sequence results.
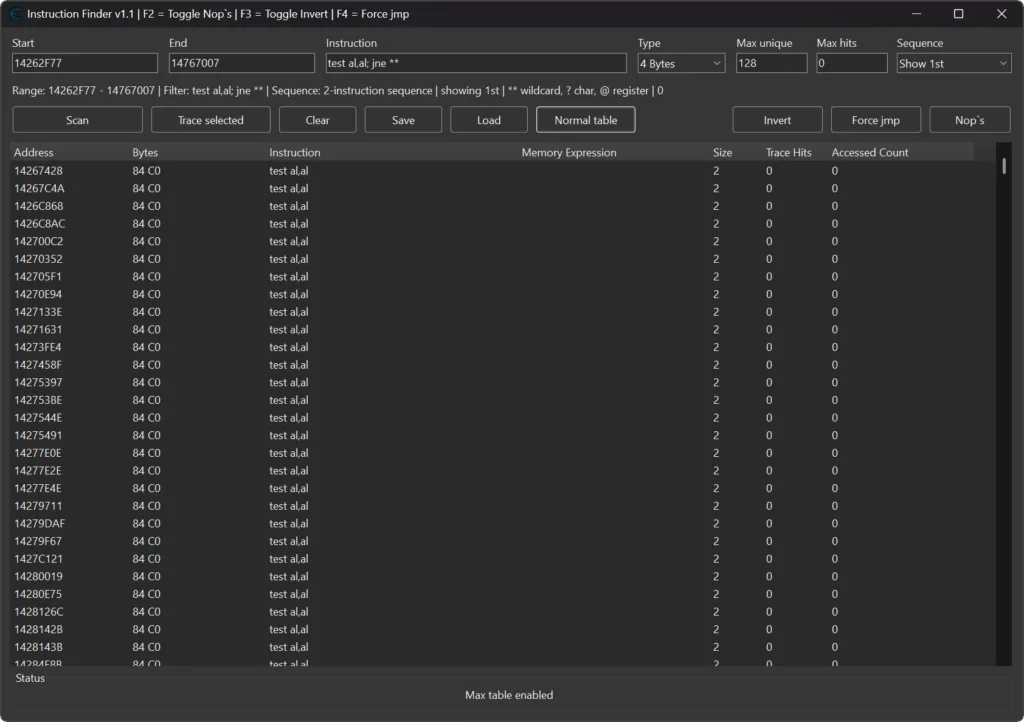
📐 Added Normal, Mini, and Max table modes.
↕️ Added Max table mode, which hides the accessed-address section and expands the instruction table.
🧹 Added stack-offset and duplicate-access filtering improvements.
⚡ Added batched clearing/loading for instruction/access rows to reduce redraw lag.
⏱️ Added cached selected-row counting and debounced preview refreshes.
📊 Added centered Status label layout, taller status area, and visible load-progress updates.
↩️ Added large reverse range offset menu items for the Start and End fields.
🧩 Moved batched ListView helper functions onto the plugin table to avoid Cheat Engine Lua local-variable limits.

📌 Plugin Information 📌
- Name: MiMemory Viewer – Instruction Finder
- Version: 1.1
- Author: mul0
- Website: https://mul0.com/
- Platform: Cheat Engine Lua plugin
⚡ What the Plugin Does ⚡
Instruction Finder opens a resizable tool window from Cheat Engine’s Memory Viewer. The window contains a scan range, an instruction filter, value display settings, trace limits, and two result tables.
The first table lists matching disassembly instructions. The second table lists accessed addresses collected while tracing selected instructions with execute breakpoints.
This makes it easier to:
- Search a selected area of disassembly for single-instruction or sequence patterns.
- Find instructions that use memory expressions such as [eax+10], [esi+000005A5], or similar operands.
- Trace selected instruction rows and collect the addresses touched by those instructions.
- Use selected-row NOP, Invert, and Force JMP actions directly from the Instruction Finder window.
- View accessed values as bytes, integers, floats, doubles, or arrays of bytes.
- Compare hit counts and unique accessed-address counts.
- Filter noisy stack-offset rows and duplicate accessed addresses.
- Switch between Normal, Mini, and Max table layouts depending on how much result space you need.
- Save and load scan/access results as TSV files.
🚀 Key Features 🚀
✨ Custom Disassembly Range Scan
- Set a Start and End address and scan only the part of the disassembler you care about. When the window opens, the plugin can fill the range around the currently selected Memory Viewer address. The Start and End fields also include larger reverse range offset presets for quickly expanding a scan backwards from the current location.
✨ Instruction Search With Wildcards
The instruction filter supports plain text and extended wildcard tokens:
- * or ** – any text fragment.
- ? – one unknown character.
- @ – any general register except stack/base/instruction pointer registers such as esp, ebp, eip, rsp, rbp, and rip.
Example: mov al,[e** can match instructions such as mov al,[esi+000005A5] or mov al,[eax+10].
Example: mov al,[@ can match memory reads through many different registers.
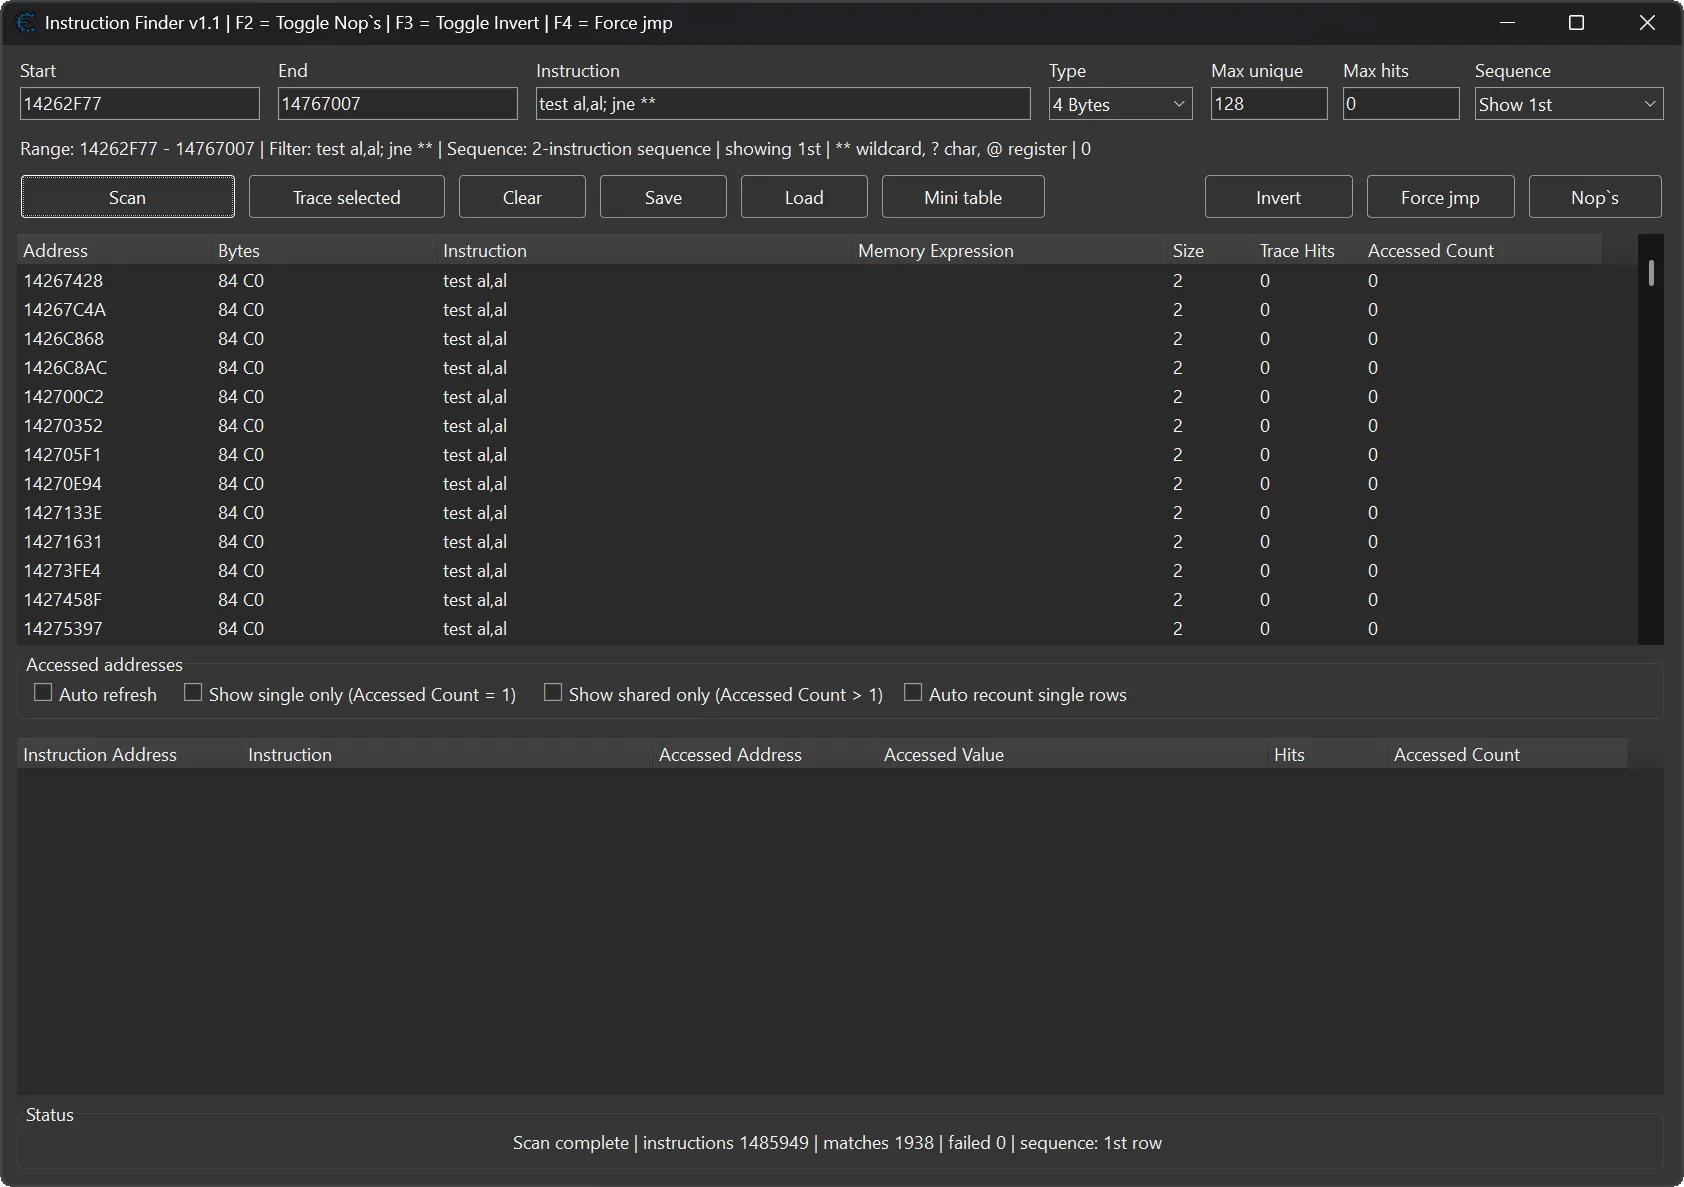
Version 1.1 also supports semicolon-separated sequence searches. For example, test cl,cl; je ** can find a two-instruction pattern, and the sequence display selector lets you choose whether the result table shows the first or second matched instruction.
✨ Sequence Search Display
- Use the sequence display combo box to control which instruction is shown when a semicolon sequence matches. This is useful when you search for a condition plus a jump, but want the final result to focus on the instruction that matters for tracing or patching.
✨ Instruction Presets
Right-click the instruction filter field to choose common presets, including:
- fld dword ptr [e**+00
- fstp dword ptr [e**+00
- movss xmm?,[e**+00
- movss [e**+00****],xmm?
- mov e**,[e**+0
- cmp [e**+
- test e**,e**
✨ Trace Selected Instructions
- Select one or more found instruction rows and click Trace selected. The plugin places execute breakpoints on traceable rows, waits for the target code to run, evaluates the bracketed memory expression, and records the accessed addresses.
- The trace table shows the Instruction Address, Instruction, Accessed Address, Accessed Value, Hits, and Accessed Count.
✨ Selected-Row Patch Actions
- Version 1.1 adds selected-row NOP, Invert, and Force JMP actions with restore tracking. These actions are available from the form buttons, context menu, and the F2, F3, and F4 hotkeys.
✨ Trace Limits
- Use Max unique to stop tracing after a selected instruction reaches a specific number of unique accessed addresses. Use Max hits to stop after a specific number of breakpoint hits. A value of 0 means unlimited for that field.
✨ Live Value Display
- The accessed-value column can display data as 1 Byte, 2 Bytes, 4 Bytes, 8 Bytes, Float, Double, or Array of Bytes. The Auto refresh option updates values in small batches.
✨ Access Filters
The result tables include filters for common cleanup tasks:
- Hide [esp+] / [ebp+] filters stack-offset rows from the instruction or access table.
- Show single only shows rows where the instruction touched exactly one unique accessed address.
- Show shared only shows rows where the instruction touched more than one unique accessed address.
- Hide duplicate accessed addresses keeps the access table easier to review when the same address appears multiple times.
- Auto recount single rows can re-check rows with Accessed Count = 1 in a small queued batch.
✨ Table Modes, Status, and Performance
- Normal, Mini, and Max table modes let you choose how much space the instruction and accessed-address tables use. Max mode hides the accessed-address section and expands the instruction table for larger scans.
- The selected instruction count is cached and shown in the preview label, while debounced preview updates help avoid selection lag.
- Large clear/load operations are batched so saved instruction and access rows can refresh with less redraw lag. The Status area was also centered, expanded, and updated with visible load-progress messages.
✨ Save and Load Results
- The Save button exports both tables to a TSV file. The file stores metadata such as version, save time, value type, scan range, and instruction filter. The Load button restores saved instruction and access rows.
⌨️ Hotkeys and Shortcuts ⌨️
- Ctrl+Shift+E – open Instruction Finder from the active Memory Viewer.
- Ctrl+A – select all rows in the active result table.
- Ctrl+C – copy selected rows from the active result table.
- Delete – delete selected rows from the instruction table.
- F2 – toggle NOP patching on selected instruction rows.
- F3 – toggle Invert patching on selected instruction rows.
- F4 – apply Force JMP patching to selected instruction rows.
- Double-click an instruction row – jump to that instruction in the Memory Viewer disassembler.
- Double-click an access row – jump to the instruction address.
- Shift + double-click an access row – jump to the accessed address in the hexadecimal view.
The instruction and access tables also include right-click context menus for tracing, selected-row patch actions, copying, filtering, deleting rows, and jumping to addresses.
📒 Example Workflow 📒
- Attach Cheat Engine to the target process.
- Open Memory Viewer and select an address near the code you want to inspect.
- Open Search – Instruction Finder or press Ctrl+Shift+E.
- Enter an instruction filter, for example mov al,[e**, mov al,[@, test cl,cl; je **, or one of the built-in presets.
- Click Scan. The scan starts after a short delay, and the same button can cancel or stop it.
- For sequence searches, use the sequence display selector to choose whether the first or second matched instruction should appear in the result table.
- Select one or more rows that contain memory expressions in brackets.
- Click Trace selected, then trigger the target code in the game or application.
- Review accessed addresses, values, hit counts, and unique counts in the access table.
- Use the selected-row patch buttons or F2, F3, and F4 when you need quick NOP, Invert, or Force JMP actions.
- Use filters, copy rows to the clipboard, or save the tables as a TSV file.
⚙️ Installation ⚙️
- Download MiMemory Viewer – Instruction Finder.lua.
- Copy the file into Cheat Engine’s autorun folder: Cheat Engine\autorun\
- Restart Cheat Engine.
- Open Memory Viewer.
- Open Search – Instruction Finder or press Ctrl+Shift+E.
⚠️ Notes ⚠️
- Tracing uses Cheat Engine’s debugger breakpoint API.
- Only instruction rows with bracketed memory expressions can be traced.
- Run the target code while tracing so the breakpoints can collect real accessed addresses.
- Large ranges can take longer to scan, so start with a focused range around the code you are researching.
💬 Feedback & Support 💬
Have suggestions, bug reports, or workflow ideas? Leave a comment below.
Attachments
| File | Date added | Added by | File size | Downloads |
|---|---|---|---|---|
 MiMemory Viewer - Instruction Finder (v1.1).zip
|
June 25, 2026 6:56 PM | mul0 | 361 KB | 43 |
|
MiMemory Viewer - Instruction Finder (v1.0).zip
|
June 4, 2026 10:33 AM | mul0 | 123 KB | 82 |