
🔍 Callsite Monitor – Plugin for Cheat Engine 🔍
Lightweight plugin for Cheat Engine, designed to analyze how a function is being called at runtime.
It tracks and counts return addresses (call sites) that invoke a selected function, giving you clear insight into execution flow, caller frequency, and hot paths during debugging. 🚀
Callsite Monitor is a Cheat Engine Lua plugin designed for function call analysis and return address tracking. This Cheat Engine call tracking plugin helps you monitor function callers in real time, making reverse engineering and debugging significantly easier.
📢 What's new ? [v1.3] [04/06/2026]
🗔 Added Multi-Window support to open independent monitor windows for different functions simultaneously.
🔄 Reuses and focuses an existing monitor window when tracking the same function address again.
🧹 Enhanced memory management (auto-freed forms on close) to prevent memory leaks.
🛠️ Centralized symbol/hex address formatting and cleaned up column auto-resizing code.
📢 What's new ? [v1.2] [18/03/2026]
✨ Fixed minor bugs and improved overall stability.
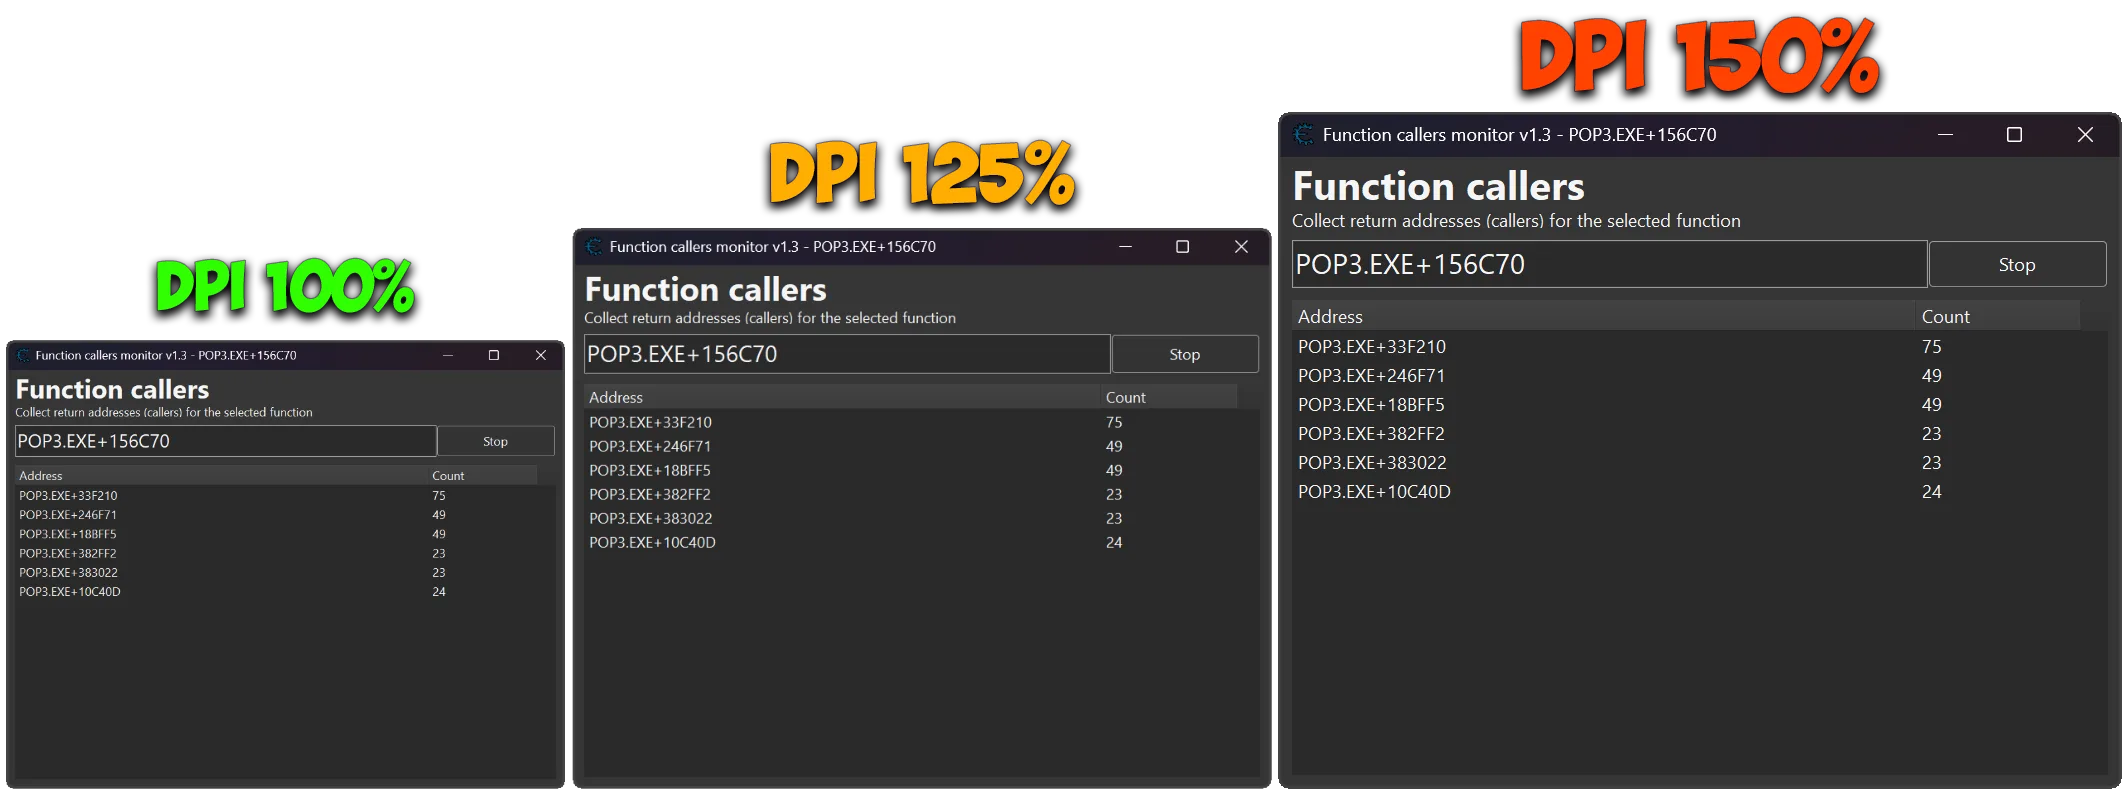
🔁 Improved font scaling for better readability.
⚙️ Optimized breakpoint callback for reduced overhead.
🚀 Enhanced error handling and input validation.
🎨 Fully DPI-aware (100% / 125% / 150%)
📢 What's new ? [v1.1] [02/03/2026]
✨ Full x86 and x64 support added (automatic stack pointer detection).
⚙️ Dynamic register handling implemented using getPointerSize() and getRegisterValue().
🔁 Multiple fallback strategies added for reliable stack pointer resolution.
🛡️ Breakpoint callback logic improved with protected calls (pcall) for better safety.
🔄 Increased compatibility across different Cheat Engine versions.
🚀 Improved overall debugger stability and runtime reliability.
🎨 No UI changes in this update.

📌 Plugin Information 📌
- Version: 1.3
- Author: Skyrimfus (original) + improvements by mul0
- Website: https://mul0.com
- Platform: Cheat Engine (Lua plugin)
- Hotkey: Ctrl + Alt + F
🔥 Key Features 🔥
- Sets a breakpoint on a selected function.
- Captures the return address from the stack (RSP / ESP) on each function entry.
- Counts how many times each callsite invokes the function.
- Multi-Window support allows monitoring multiple functions at the same time.
- Ideal for reverse engineering, profiling, and behavioral analysis.
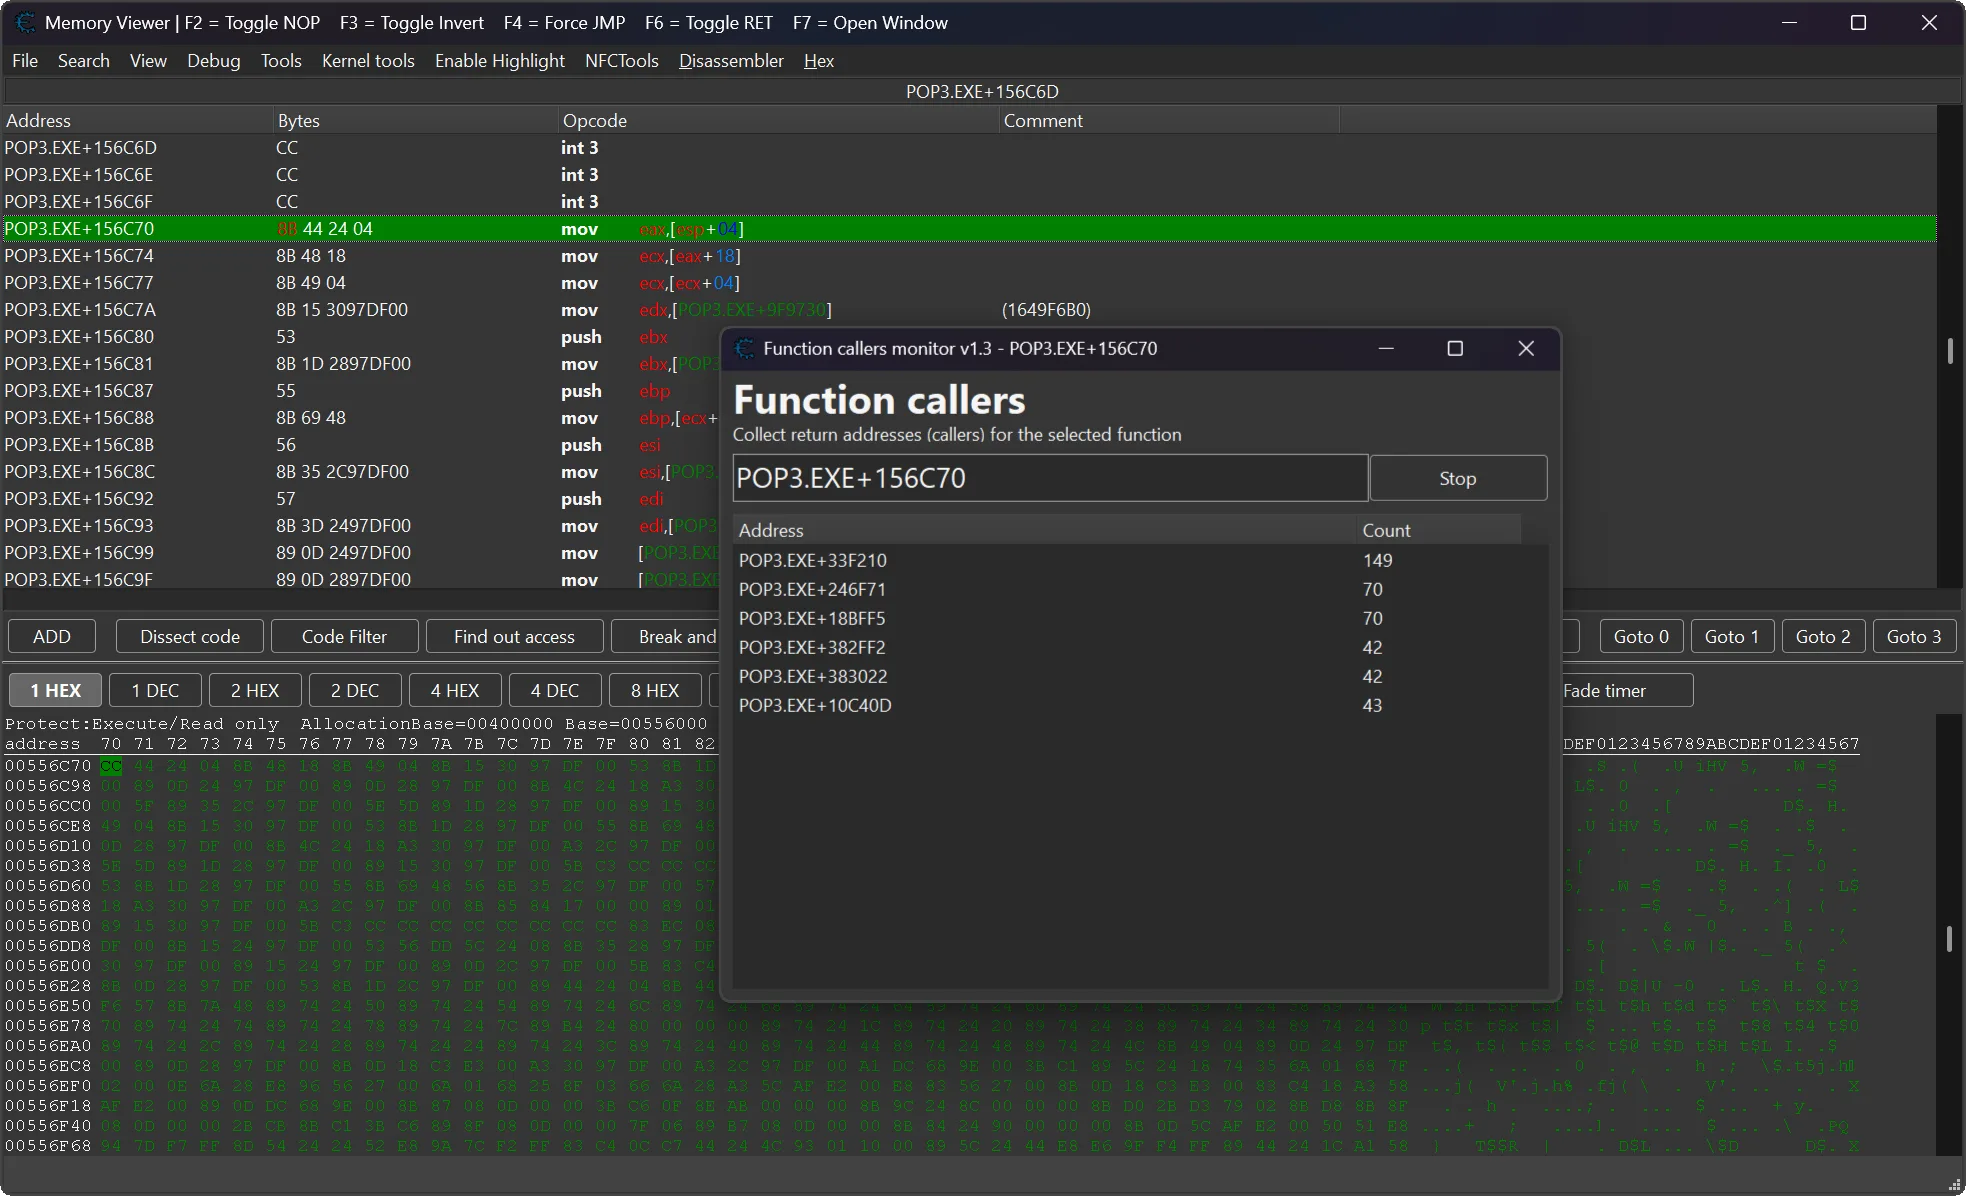
📊 Live Caller Statistics 📊
- Real-time updating list of caller addresses.
- Each entry shows:
- Caller address / symbol name (if available)
- Invocation count
- UI updates efficiently, only when values change.
🖥 Interactive Callers Window 🖥
- Clean, DPI-aware resizable interface.
- Double-click any caller to instantly jump to it in the Memory Viewer.
- Independent tracking windows for each function, with smart reuse to prevent duplicate windows.
- Column auto-resizing for optimal readability.
⌨️ Shortcuts & Integration ⌨️
- Users can select any instruction directly in the Memory Viewer and press Ctrl + Alt + F.
- The Callsite Monitor window opens automatically.
- The plugin immediately starts tracking callers for the selected instruction without any additional input.
- This allows instant analysis of function callers straight from the disassembler, significantly speeding up reverse-engineering and debugging workflows. ⚡
📋 Productivity Tools 📋
- Multi-select support in the callers list.
- Copy selected entries to clipboard (Address | Count).
- Shift-click support to quickly use the currently selected disassembler address.
⚙️ How It Works (Technical Overview) ⚙️
- A breakpoint is placed at the target function entry.
- On each hit, the plugin reads the return address from the stack.
- Return addresses are aggregated and counted.
- Results are displayed live without interrupting execution flow.
This approach keeps runtime overhead minimal while providing highly actionable insights. 🧩
⚙️ Installation ⚙️
- Place the “MiMemory Viewer – FunctionCallers.lua” file into Cheat Engine’s autorun (Cheat Engine\autorun) folder
- Restart Cheat Engine.
- Open the Memory Viewer and start monitoring function callers instantly.
💬 Feedback & Support 💬
Have suggestions or need help? Drop a comment below! 🙌
Attachments
| File | Date added | Added by | File size | Downloads |
|---|---|---|---|---|
 MiMemory Viewer - FunctionCallers (v1.3).zip
|
June 4, 2026 8:47 PM | mul0 | 422 KB | 110 |
|
MiFunctionCallers (v1.2).zip
|
March 18, 2026 10:06 AM | mul0 | 290 KB | 72 |
|
MiFunctionCallers (v1.1).zip
|
March 2, 2026 11:16 AM | mul0 | 187 KB | 27 |
|
MiFunctionCallers (v1.0).zip
|
February 10, 2026 6:37 PM | mul0 | 202 KB | 58 |